4.5 Coverage radius (VLR-VLT)
In this section the Free Space Model is used to derive the attenuation on the different paths and the Victim Link and Interfering Link operate at the same frequency – 1000 MHz – co-channel interference. Figure 115 presents an illustration of the various radii (i.e. coverage radius and simulation radius) that are used in SEAMCAT and with reference to the various pairs of transmitters and receivers used for a simulation.
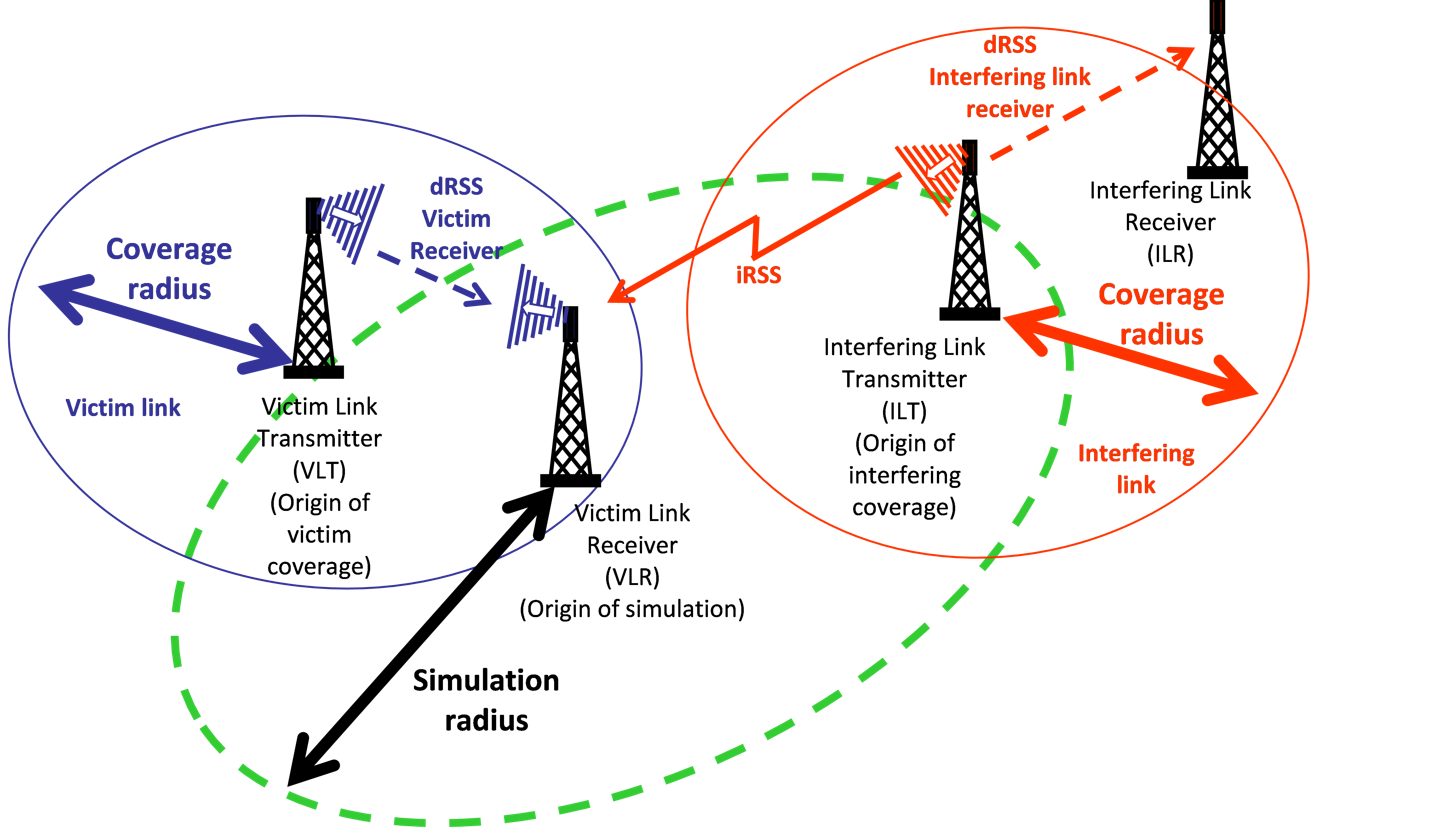
The distance between the VLT and the VLR is referred to as the coverage radius ( ) (see ANNEX 13:). In the case of mobile applications, the number of terminals that may transmit in a given cell of the network is given by:
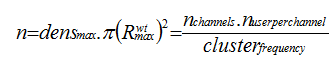
(Eq. 25)
The calculation of the coverage radius can be found in ANNEX 13:.
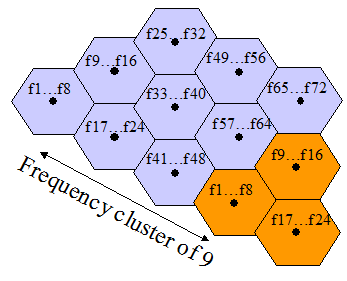
The cluster characterises the frequency re-use of a mobile network (see Figure 112).
The victim link coverage radius (i.e. centred on the victim link transmitter) may then be calculated by using the formula below. Figure 113 presents how to set-up SEAMCAT.

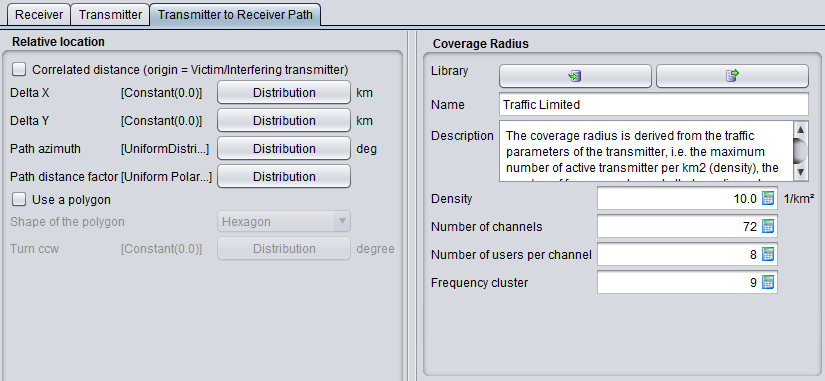
(Eq. 27)
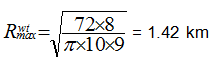
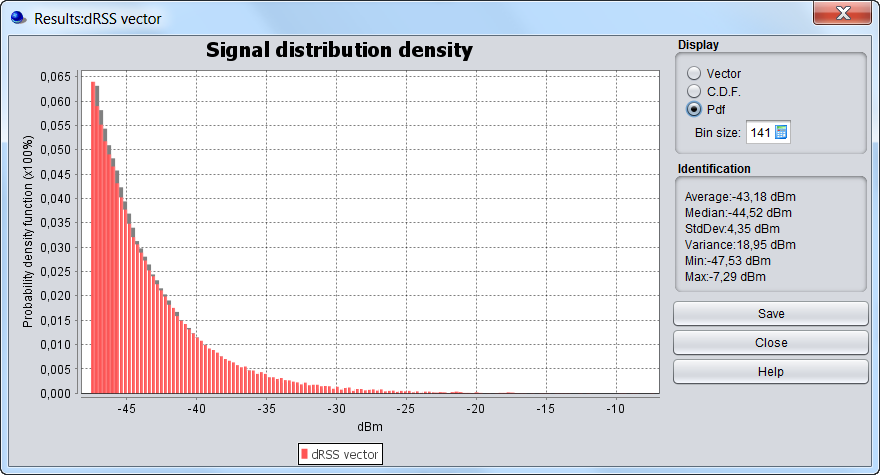
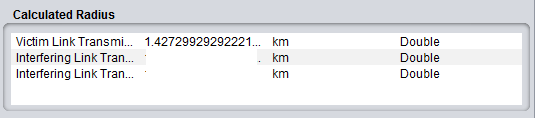
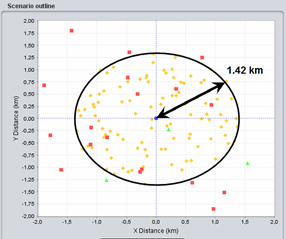
Figure 115 presents the results of the dRSS vector and the results in the coverage radius of the victim link.
The dRSS for a receiver located at the edge of the coverage area may be calculated:
dRSS = 30 (dBm) + 9 + 9 - (32.5 + 10 log(1.43^2) + 20 log(1000)) = -47.5 dBm