
12.8.3 Inspect selected element
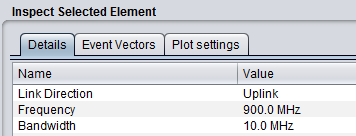
12.8.3.1 Detail
When an element of the main plot is selected, its detailed information is shown in a table. Further detailed are presented in Annex A15.1 with respect to CDMA network, Detailed of voice users, cell.
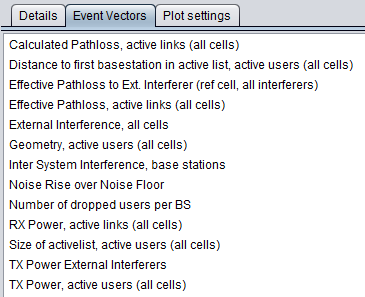
12.8.3.2 Event Vectors
You are able to investigate some intermediary output vectors resulting from the cellular simulation.
For the position information (x,y) of the active UE details, all coordinates are always shown in the SEAMCAT coordinate system which by definition either the VLT or the victim reference cell in (0,0). Therefore, the position of the elements of an interfering CDMA or OFDMA system is based on the victim reference cell and not its "internal" reference cell.
|
|
|
|---|
|
Name |
Description |
|
Calculated pathloss |
Raw parthloss for all the active links (i.e. active UE to ist serving BS) |
|
Distance to first BS |
Distance from UE to its serving BS (first refer to cases where tri-sector is active) |
|
Effective Pathloss to Ext. interferer (all victims, all interefers) |
Effective pathloss between all the victims and all the external interferers |
|
Effective pathloss, active links |
Effective pathloss between all the victims and there respective serving BSs. Results of the below equation for all the active links |
|
External interference, all cells |
Sum of the iRSSblocking and iRSSunwanted at each victim cell |
|
Geometry |
Evaluate the Geometry for the active users for the all network |
|
Inter System Interference |
Evaluate the interference from your own network |
|
Noise rise over the noise floor |
Evaluate the Noise rise over the noise floor |
|
Number of dropped users per BS |
Evaluate the Number of dropped users per BS |
|
Rx power, active links |
Received power at the victim serving BS (UL) or active UE (DL) from its own system (used for investigating the inter-system interference from other cells) |
|
Size of active list |
Size of active list |
|
Tx power external interferers |
Tx power from the interferer |
|
Tx power, active users |
Tx power from its own system |
|
Name |
Description |
|
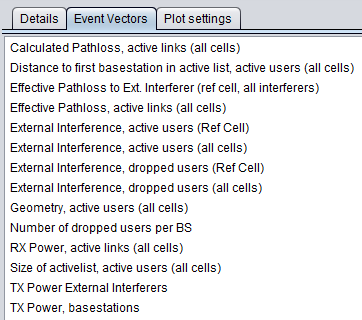
External interference, active users (all cells) |
Evaluate the external interference on all the active users for the whole network |
|
External interference, active users (ref cell) |
Evaluate the external interference on all the active users for the reference cell only |
|
External interference, dropped users (all cells) |
Evaluate the external interference on all the dropped users for the whole network |
|
External interference, dropped users (ref cell) |
Evaluate the external interference on all the dropped users for the reference cell only |
|
|
|
|---|---|
|
(a) |
(b) |
|
Name |
Description |
|
Calculated pathloss |
Raw parthloss for all the active links (i.e. active UE to ist serving BS) |
|
Distance to first BS |
Distance from UE to its serving BS (first refer to cases where tri-sector is active) |
|
Effective Pathloss to Ext. interferer |
Effective pathloss between all the victims and all the external interferers |
|
Effective pathloss, active links |
Effective pathloss between all the victims and there respective serving BSs. Results of the below equation for all the active links |
|
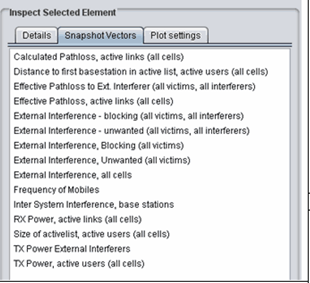
External interference –blocking (all victims – all interferers) |
iRSSblocking for each of the victim UE interferered by each interferer |
|
External interference –unwanted (all victims – all interferers) |
iRSSunwanted for each of the victim UE interferered by each interferer |
|
External interference –blocking (all victims) |
Aggregate external interference iRSSblocking for each of the victim UE. Sum over all the interferers |
|
External interference –unwanted (all victims) |
Aggregate external interference iRSSunwanted for each of the victim UE. Sum over all the interferers |
|
External interference, all cells |
Sum of the iRSSblocking and iRSSunwanted at each victim cell |
|
Frequency mobiles |
Vector of the frequency of the UE (in UL) for each active link |
|
Inter System Interference |
Evaluate the interference from your own network |
|
Rx power, active links |
Received power at the victim serving BS (UL) or active UE (DL) from its own system (used for investigating the inter-system interference from other cells) |
|
Size of active list |
Size of active list |
|
Tx power external interferers |
Tx power from the interferer |
|
Tx power, active users |
Tx power from its own system |
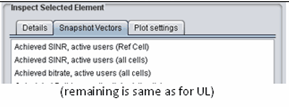
Table 60: Output vector results for OFDMA DL (the rest of the vectors are like for the UL)
|
Name |
Description |
|
Achieved SINR, active users (ref cell) |
Achieved SINR in the ref cell only |
|
Achieved SINR, active users (all cells) |
Achieved SINR for the all system |
|
Achieved bitrate, active users (all cells) |
Achieved bit rate for the all system |
12.8.3.3 Plot settings
The plotting options control how the system is shown in the main plot area and how you select elements from the system. This potting option can be seen on the overview page Figure 270.
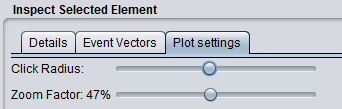
You can zoom in and out by using either the mouse wheel or the Zoom Factor slider. When clicking on a displayed item SEAMCAT tries to match the coordinates of the click to a cellular element – selecting the first matched item.
When SEAMCAT tries to match the click to an element it allows for a certain amount of uncertainty when matching the coordinates. This uncertainty is also called click radius to illustrate the effect of the actual click point being in the centre of a circle used to search for CDMA elements. You can adjust the “click radius” and in combination with the zoom this allows for all elements to be selected using the algorithm supplied above.
It is often the case that an element different than desired or no element at all is selected when clicking the plot. This problem is resolved by zooming in and possibly changing the click radius.