2.16 Testing propagation models
A sanity check on the suitability of a propagation model can be done by clicking on <Tools/Test Propagation Models> in the main menu of SEAMCAT, by clicking on the icon ( ) of the toolbar or by pressing <CTRL+SHIFT+M>. With this feature, it is possible to evaluate the result while using a certain propagation model.
 Figure 50: Access to testing propagation model
For that, choose the propagation models to compare them. It is possible to compare 2 or more propagation models with this interface.
Figure 51 shows that the SEAMCAT resulting attenuation from the free space is 101.47 dB where the free space path loss is defined as:
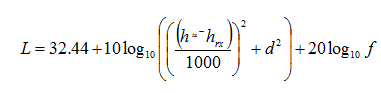 (Eq. 16)
where d is given in km and f is given in MHz. This results in

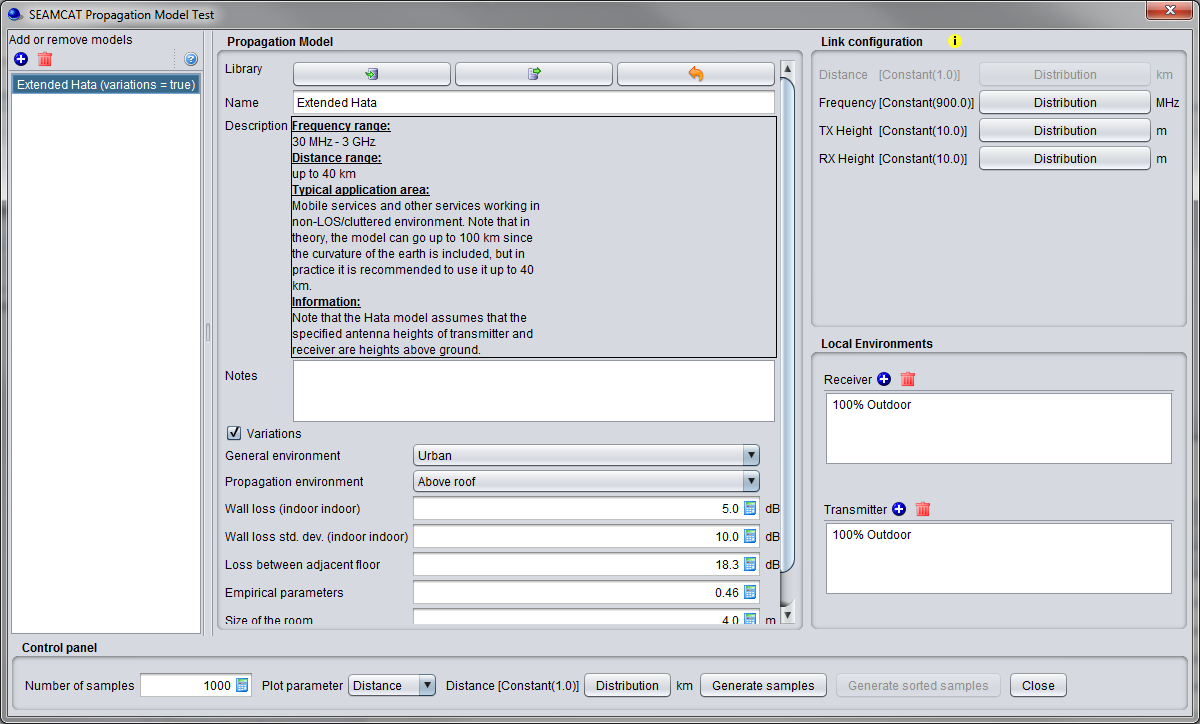
Figure 51: Illustration on to check the propagation model results
If one parameter is chosen as a distribution (for instance distance), then the button <generate sorted samples > is activated. Pressing it enables you to plot your results according to a sorted X-axis from min to max.
Finally click on <Generate samples> or <generate sorted samples> (depending which one is active) to view the results. If no results are displayed, check the Java console for any error messages.
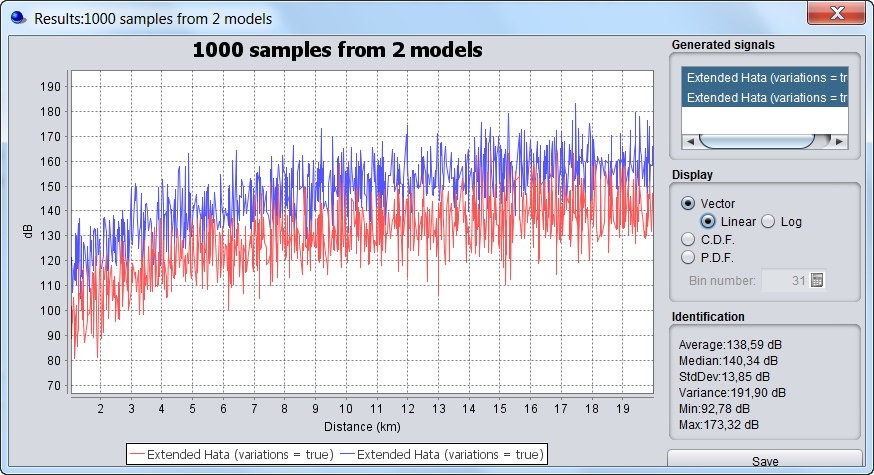
Figure 52: Example comparing 2 propagation loss using the “generate sorted samples”. You can display the vector in linear or logarithmic scale