# Introduction

After running a simulation with **<span class="fabric-text-color-mark" data-renderer-mark="true" data-text-custom-color="#000000">generic system</span>**, each of these signals is displayed with indicated array size (i.e. the number of valid generated events), unit and then the type (vector, double etc..).

Double-clicking on one of the vectors, the signal dialog window (see Annex A1.5) will plot the signal as well as its statistical features.

![image.png](https://wiki.cept.org/uploads/images/gallery/2026-04/scaled-1680-/vczQ72rncATJjq6s-image.png)

<div class="rich-media-item mediaSingleView-content-wrap image-align-start css-1clm7rd" data-layout="align-start" data-media-vc-wrapper="true" data-node-type="mediaSingle" data-renderer-start-pos="349" data-vc="media-single" data-width="629" data-width-type="pixel" id="bkmrk--1"><div class="css-1nrvn1l"><div data-alt="" data-collection="contentId-512129" data-context-id="512129" data-file-mime-type="" data-file-name="file" data-file-size="1" data-height="479" data-id="03cb8c1c-aed9-4d88-83ff-4c4daa89c2d3" data-node-type="media" data-renderer-start-pos="350" data-type="file" data-width="754"><div class="_2rko18qm _vchhusvi _kqswh2mm _ect4ttxp _p12f1osq _c71l1osq _1bsb1qmm _4t3ine4n _1hlmd0i9 _1rquusvi _eg541i5c _mts3kb7n _1ntskb7n _yfmhtlke _5sb1v00u new-file-experience-wrapper" data-media-vc-wrapper="true" data-testid="media-card-view" id="bkmrk--2"><div class="_1reo15vq _18m915vq _2rko18qm _1e0c1txw _kqswh2mm _p12f1osq _1bsb1osq _4t3i1osq _c71l1osq media-file-card-view" data-cursor="pointer" data-test-media-name="7.png" data-test-progress="1" data-test-source="remote" data-test-status="complete" data-testid="media-file-card-view"></div></div></div></div></div><div class="fabric-editor-block-mark fabric-editor-alignment align-center" data-align="center" id="bkmrk-figure-247%3A-list-of-">**
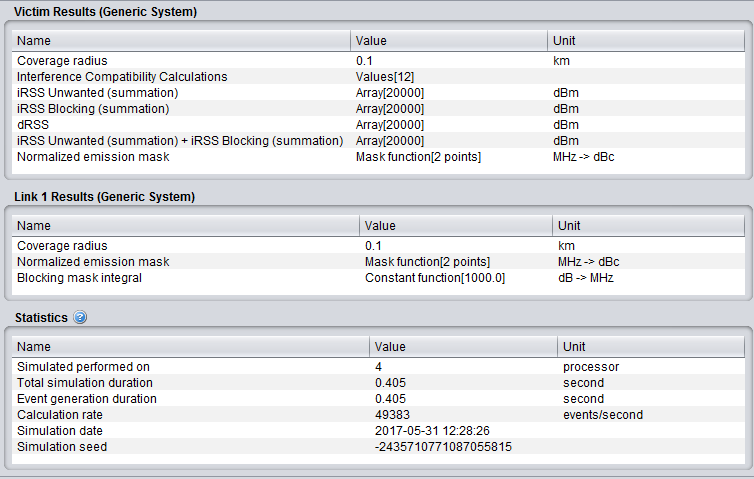
Figure 247: List of the output results for generic vs generic simulation**</div>