12.5 CDMA output results
12.5.1 CDMA capacity finding
During the pre-simulation part, the system estimates the load of the network as shown in Figure 259. The results are presented as in Figure 260.


12.5.2 CDMA results
Once SEAMCAT has completed the simulation, the results are shown as displayed in Figure 261, when the CDMA network is the victim. This figure presents the difference between the 2 steps power balancing process (1-initial power balancing, 2- power balancing after introduction of an external interference), that is to say " non-interfered capacity " is the number of UEs in the victim network prior to adding an external interferer and "interfered capacity" is the number of UE in the victim network after adding the external interference.
-
Units: number of connected UEs;
-
Initial capacity: Number of connected UEs before any external interference is considered;
-
Interfered capacity: Results after External interference is applied;
-
Excess outage, users: How many UEs were dropped due to external interference;
-
Outage percentage: Percentage of UEs dropped due to external interference.
When the CDMA system is the interfering link, the total received power at the receiver in the victim link, due to the transmit power of all the active mobile stations in the three cells of the center cell site of the CDMA cluster, adjusted for spectral masks, etc., is counted as the interfering power in the victim link. Therefore, it is not necessary to keep track of any capacity loss in this case, unless the victim link is also a CDMA system.


SEAMCAT is able to calculate (for CDMA) 3 losses:
1) Loss of UEs for the whole network based on the before and after number of UE
System capacity loss = 100 - (interfered_capacity/ non-interfered_capacity)*100 (Eq. 70)
2) Loss of UEs for the reference cell based on the before and after number of UE
Ref cell capacity loss = 100 - (interfered_capacity/ non-interfered_capacity)*100 (Eq. 71)
3) Loss of UEs for the whole network based on the total number of dropped UE
System capacity loss = total_dropped_UE_system/total_simulated_UE*100 (Eq. 72)
It is quite important to understand that there is not a 1-to-1 map between non-interfered active/interfered users and the dropped users. Dropped user can occurs at many level of the algorithm, it can be due to:
-
“Unable to connect during first initialisation of UE” during the initialization (long before the step 2 balancing) but still it will be registered;
-
During the balancing. For CDMA UL (no cell selection activated), when the noise rise is balanced, i.e. the number of UE is acceptable is reached after introduction of external interferers, then the BS estimates the signal-to-interference ratio (C/I), measured in bit energy-to-noise density ratio Eb/N0, and compares it to a target value (Eb/N0_target). If the difference between the estimated C/I and the Eb/N0_target, is higher than a call drop threshold, then the UE is dropped;
-
“Eb/No requirement does not meet while scaling the channel power” during the scaling power.
12.5.3 CDMA results for cell selection algorithm
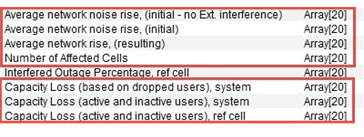
When the CDMA “cell selection” algorithm is simulated, the following output vectors are also available for scrutiny:
-
Average network noise rise (initial without external interference): value at step 1 (i.e. before the algorithm - see Annex A15.3.2)
-
Average network noise rise (initial): value at step 5 (i.e. before the algorithm - see Annex A15.3.2)
-
Average network noise rise (resulting): value at step 10 (i.e. after the algorithm - see Annex A15.3.2)
-
Capacity loss in the whole network (for each event, calculate the capacity loss in %).
-
Capacity loss in the reference cell per event
-
Capacity loss in the worst cell per event (the first strongest cell: selectedCell[1]). The cell-ID can be different from event to event but the capacity loss is to be extracted).
-
The number of cells affected per event.