12.3 Generic model Results
- Introduction
- 12.3.1 Generated signals results
- 12.3.2 Calculated radius
- 12.3.3 Intermodulation results
- 12.3.4 Overloading results
Introduction
After running a simulation with generic system, each of these signals is displayed with indicated array size (i.e. the number of valid generated events), unit and then the type (vector, double etc..).
Double-clicking on one of the vectors, the signal dialog window (see Annex A1.5) will plot the signal as well as its statistical features.

12.3.1 Generated signals results
-
dRSS folder (ANNEX 4:) with dRSS vector;
-
iRSS unwanted folder (ANNEX 5:) with as many iRSSunwanted vector for each interfering link and one vector for the sum;
-
iRSS blocking folder (ANNEX 5:) with as many iRSSblocking vector for each interfering link and one vector for the sum.
12.3.2 Calculated radius
The calculated radius folder contains the values of the coverage and/or simulation radii calculated for the event generation when set to non-correlated (See ANNEX 13:).
12.3.3 Intermodulation results
iRSS intermodulation folder (Figure 248) with as many iRSSintermod vector for each combinatory couple in case there are more than one interfering link and one vector for the sum.

Figure 248: Intermodulation results folder
12.3.4 Overloading results
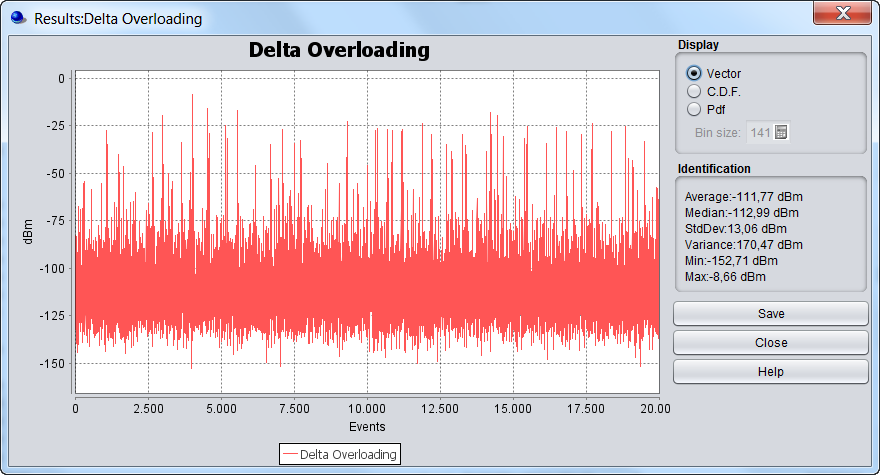
As a result of the equation described in Annex A5.4, for each event and at each frequency, the sum of the iRSSoverloading (iRSSsum_overloading) will be compared to the overloading treshold Oth(fi) at that frequency (fi). The difference, delta (in dB), will be stored.
-
When delta ≥ 0, then the receiver is overloaded at that fi (i.e. the rest of the frequency do not matter);
-
When delta < 0, then the receiver is not overloaded at fi.
If only one frequency is present, the iRSSsum_overloading is compared to the Oth(fi)and the difference will be stored for that event. If more than one frequency is present, the highest delta value will be indicated in the vector (i.e. irrespective of the frequency) such that
for each event j (where dRSS > sensitivity){
for Frequency = i to number of total frequencies{ delta_max(j) = max(delta(fi)); } (Eq. 67)
}

The output delta overloading vector is of the dimension delta x number of events